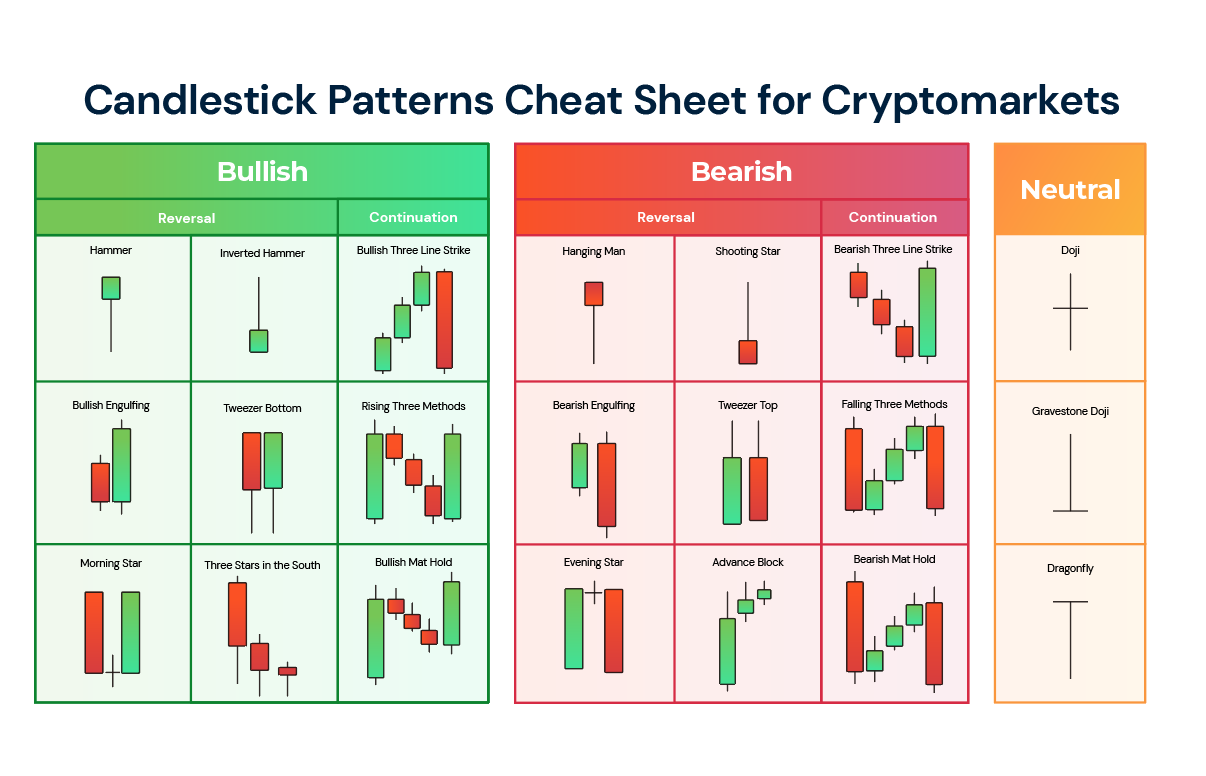
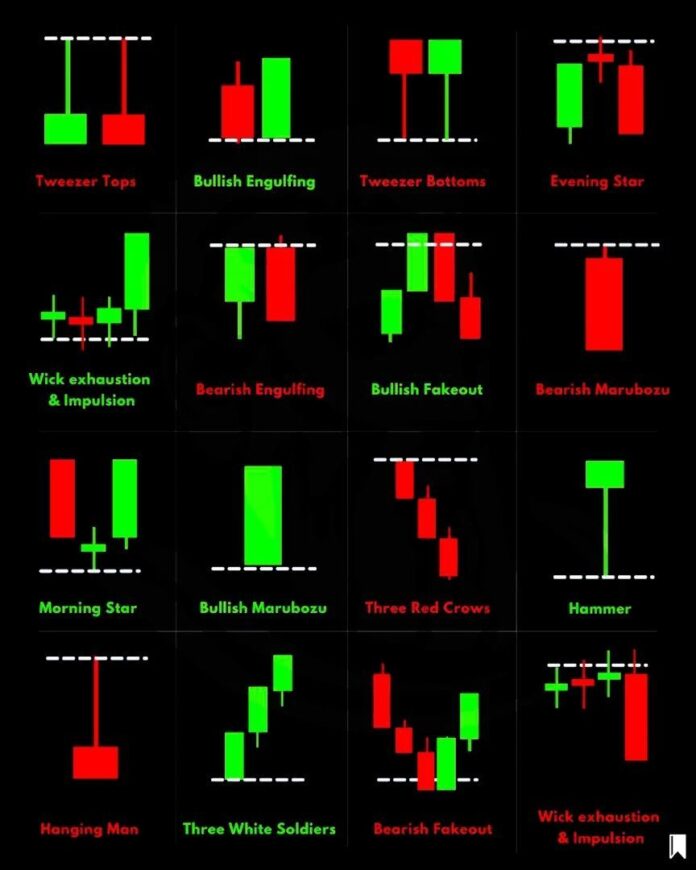
Learn Candlestick Patterns
Candlestick patterns are a powerful tool used by stock and crypto traders to predict the direction of the stock market. Candlestick patterns can show the trader's psychology and decisions can be based on them.
Candlestick patterns are a powerful tool used by stock and crypto traders to predict the direction of the stock market. Candlestick patterns can show the trader's psychology and decisions can be based on them.
Learn about different candlestick patterns to make informed trading decisions.
Identify bullish candlestick patterns and their significance.
Recognize bearish candlestick patterns and how they affect the market.
Understand reversal candlestick patterns and their potential impact.
Learn how trading volume can influence price movements.
Understand the significance of price gaps in market trends.
Identify and capitalize on breakout patterns in trading.
Explore the role of consolidation patterns in market analysis.
Analyze and understand long-term market trends.
Utilize market indicators for informed trading decisions.
Master the concepts of support and resistance levels.
Apply Fibonacci retracement techniques in trading.
Interpret moving averages to gauge market directions.
Discover how oscillators can indicate market momentum.
Use the RSI to identify overbought or oversold conditions.
Analyze market volatility using Bollinger Bands.
Utilize the stochastic oscillator for market entry and exit points.
Understand the MACD indicator for trend following and momentum.
Explore different time frames in candlestick charting.
Identify common chart patterns and their meanings.
Learn the Heikin-Ashi technique for better trend analysis.
Understand the psychological aspects of trading.
Learn how to determine the size of your trading positions.
Implement effective stop loss strategies to minimize losses.
Explore strategies for successful swing trading.
Learn about scalping and its application in fast-paced trading.
Understand how leverage works and its risks in trading.
Discover the world of automated trading systems.
Get started with the fundamentals of day trading.

Expand your trading vocabulary with our comprehensive dictionary.
Bull Market: A market characterized by rising prices.
Ask Price: The price at which a seller is willing to sell an asset.
Liquidity: The ease with which an asset can be bought or sold without affecting its market price.
Volatility: The degree of variation of an asset's price over time.
Margin Call: A demand from a broker for additional funds to cover potential losses.
Scalping: A short-term trading strategy that aims to profit from small price movements.
Swing Trading: A strategy that seeks to capture shorter to medium-term price swings in the market.
Arbitrage: The simultaneous purchase and sale of an asset to profit from price discrepancies in different markets.
Day Trading: Buying and selling assets within the same trading day, often multiple times.
Value Investing: A long-term strategy that focuses on buying undervalued assets with growth potential.
Stop-Loss Order: An order placed with a broker to sell an asset when it reaches a certain price, limiting potential losses.
Diversification: Spreading investments across different assets to reduce risk.
Risk-Reward Ratio: A ratio that compares the potential profit of a trade to the potential loss.
Position Sizing: Determining the amount of capital to allocate to a specific trade based on risk tolerance.
Hedging: Protecting an investment from potential losses by taking an offsetting position.

Get in touch with our support team for any assistance.
Practice your trading skills with our realistic trading simulator.
Simple Trading Simulator:
1. Choose an asset to trade.
2. Set the trading amount.
3. Predict whether the price will go up or down.
4. See how your prediction performs.
5. Repeat and improve your trading skills!